Trends in Foreign-Born and African-American
Population Change in US Counties
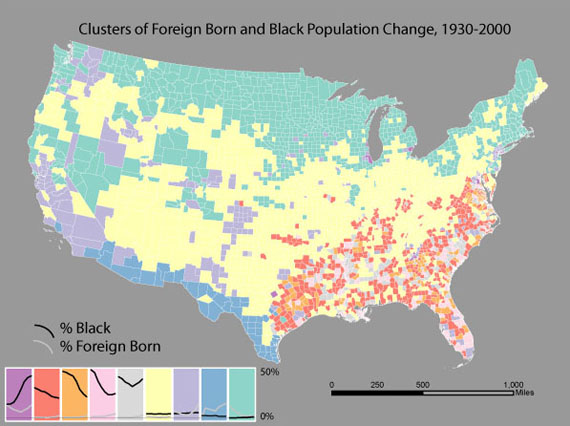
This cluster solution groups counties by similar patterns their change in percent Black and change in percent foreign-born between census years. Yellow counties indicate those with both low percent Black and low percent Foreign, and little change between 1930 and 2000. Dark purple counties belong to the smallest cluster, one in which Black population has continually increased from low to high since 1930. Shades of red indicate counties where Black population has decreased, and pink and grey counties (as well as purple) represent places where both foreign-born and Black populations are increasing. In light purple and blue counties the presence of immigrants has declined, but since the 1970’s has been increasing. In green counties, the presence of Foreign-born population has declined rapidly from the 1930’s into the 1970’s, and never recovered.
Map color schemes inspired by Color Brewer http://www.personal.psu.edu/cab38/ColorBrewer/ColorBrewer.html