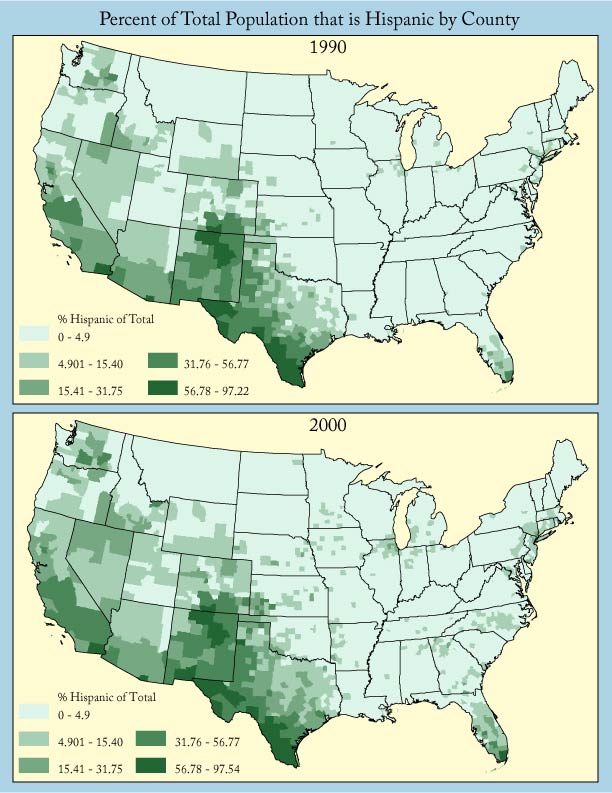
Hispanic population in the United States expanded from to 22,354,059 in 1990 to 35,305,818 in 2000. As a result of the increase in the total population, there has been a noticeable spread of Hispanic migration. In 1990 a majority of the Hispanic population within the U.S. was concentrated in the Southwestern part of the country. The percent Hispanic of the total population stayed relatively constant and high near the Mexican border and gradually spread northward and eventually eastward. Over the course of the decade the migration pattern led to Hispanic growth in the Northwest, Midwest, and parts of the South. This is visible in the accompanying maps, which show the percent of the total population that is Hispanic by county for both 1990 and 2000. While there is a clear migration trend, these maps do not show much more about where exactly the Hispanic population is growing most rapidly.
In order to identify where Hispanic population increased the fastest and what area experienced the greatest change in percent Hispanic a few calculations had to be completed on original Census Bureau statistics. To determine the rate at which counties’ Hispanic population increased or decreased over the years basic calculations were made. The rate of change by county equals the change in Hispanic population between 1990 and 2000 divided by the Hispanic population in 1990. The exact equation appears as the following: Rate Change = 100 x (Total Hispanic Population 2000 – Total Hispanic Population 1990)/Total Hispanic Population 1990. According to the map created using this variable, the Southeast and middle of the country as well as the Northwest show the most rapid Hispanic growth. And, the Southwest bordering Mexico saw the slowest growth and the most decline which is to be expected from migrants entering the states and progressing northward, away from the border.
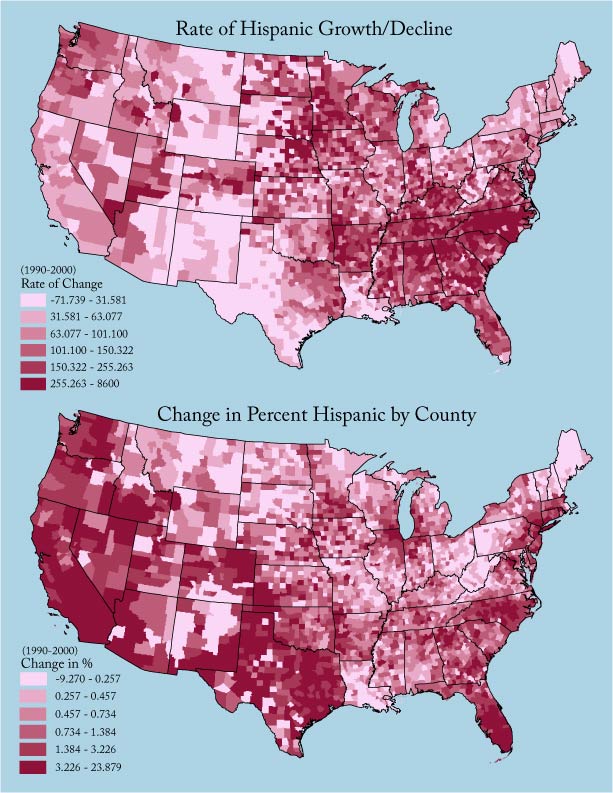
While the rate of growth in Hispanic population was fastest in the areas already mentioned, the change in the percent of the total population that is Hispanic shows another aspect of the spatial pattern. The change in percent Hispanic involved a similar calculation to the rate change variable. In order to complete this step the percent Hispanic for 2000 and 1990 were found using the following equations: 100 x Hispanic Population 1990/Total Population 1990, and 100 x Hispanic Population 2000/Total Population 2000 (by county). The change in percentage over the decade is found by calculating the difference between the percent Hispanic 1990 and the percent Hispanic 2000. The change is visualized in the accompanying map. The pattern shows that counties in the Southwest and Western United States have a higher percentage of Hispanics than states like Ohio, Missouri, and Kentucky for example. While this map is useful, it does not give much detail regarding what types of counties the Hispanic population migrated towards or occupy in the largest numbers. Thus, further variables have to be considered to draw more complex conclusions.
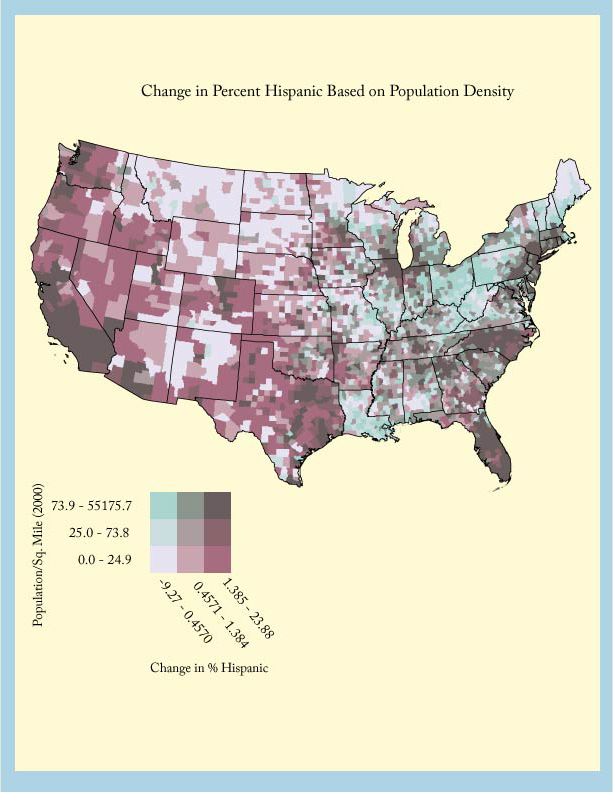
Taking a closer look at the migration and growth patterns of the Hispanic population throughout the U.S. involves many variables. An interesting category to look at is the population density of the locations that are pushing Hispanic migration out and pulling Hispanic migration in. The question at hand being: is Hispanic migration geared towards high or low density (urban or rural) areas? According to Kandel and Cromartie, “nonmetro Hispanic growth in the 1990s was much greater and more widespread than in previous decades and appeared in hundreds of rural communities throughout the Southeast, Midwest, and Northwest (Kandel, William, and John Cromartie. New Patterns of Hispanic Settlement in Rural America. Rural Development Research Rep. no. 99. May 2004. United States Department of Agriculture. 4 May 2009 <http://www.ers.usda.gov/publications/rdrr99/rdrr99.pdf>).” The accompanying bivariate map shows the spatial trend of change in percent Hispanic compared to the population per square mile by county.
The results of the visualization demonstrate the conclusions drawn by Kandel and Cromartie as there is a large increase in Hispanic population throughout the less dense counties of the West and Southwest. Less densely populated counties in the East and middle of the country have not seen much growth in the percent Hispanic, which mirrors the trends developed in previous maps shown. Sparsely populated counties are not alone in seeing an increase in Hispanic population. In fact, some cities and denser areas along the coasts have experienced a high change in percent Hispanic, but that is typical of many other immigrant population trends as well and is not necessarily unique to the Hispanic population.
While many possible variables cause Hispanic migration into and throughout the U.S., employment opportunities are a major factor. Guzman and McConnell discuss employment and migration as they state that, “Growing employment opportunities in the United States, especially in manufacturing, has been offered as one explanation for the increase of Latin American migration” in the past decade (Guzman, Betsy and Eileen Diaz McConnell. “The Hispanic Population: 1990-2000 Growth and Change.” Population Research and Policy Review 2002. 21(1-2): 109-128). The scholars explain that a majority of the manufacturing jobs are located in the Midwest and South, which corresponds to the Hispanic migration patterns visible between 1990 and 2000.
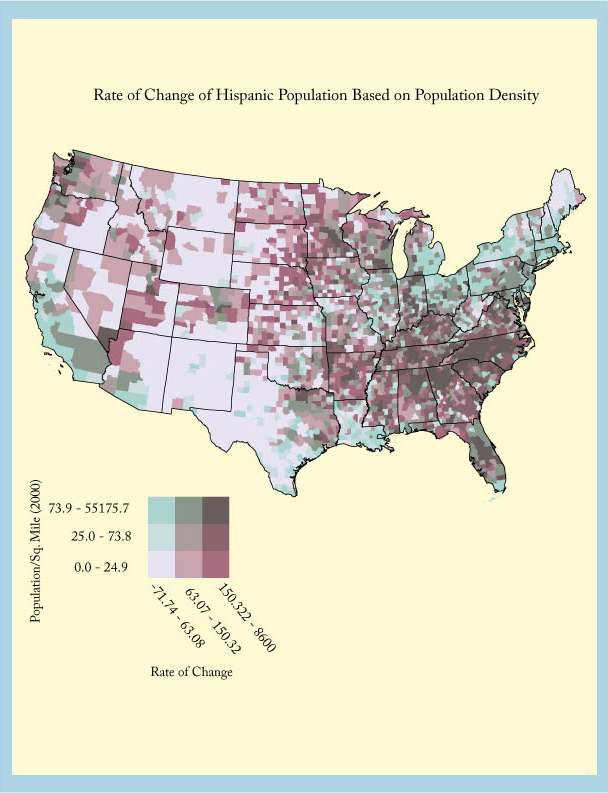
Not only is the dispersal of the Hispanic population of interest, but the rate at which the growth occurs in different areas is also intriguing. Many reports indicate the growing Hispanic population in rural areas across the country and, “In the past two decades, the Hispanic population in rural and small-town America has doubled from 1.5 to 3.2 million and now makes up the most rapidly growing segment of nonmetropolitan (nonmetro) county residents” (Kandel and Cromartie, 2004: 1). The image concerning the change rate of Hispanic population shows the trend towards growth in the central United States as well as parts of the South that had not previously seen a large increase in Hispanic population. The map also illustrates the movement away from border counties and the subsequent dispersal of the Hispanic population throughout the country.
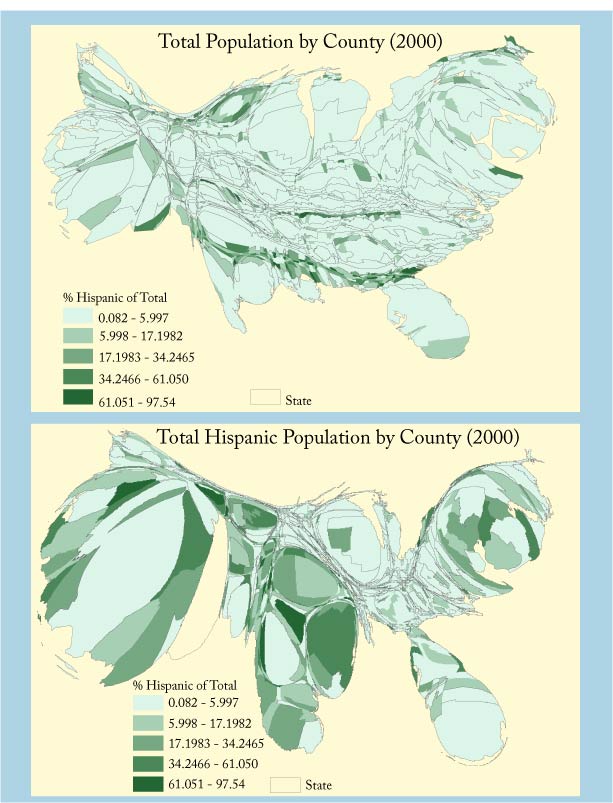
A majority of the U.S. population is located on either coast as well as in the middle of the country including states like Ohio, Kentucky, and southern states like Alabama and Georgia. In contrast, much of the Hispanic population resides on the West coast, in the Northeast, and in Southwestern states like Texas and Arizona. This differentiation is visible in the accompanying cartograms, which illustrate the Hispanic population percentage by county distorted by total population counts. The maps show that the far north along the Canadian border typically has the smallest Hispanic population, while Texas and Mexico have a large contingency of the country’s Hispanic population. The set of four cartograms show the changing face of the country and the movement of the Hispanic population in the distortion of area and variation in tone based on percent Hispanic. The images show that there was a change in the spatial distribution of the Hispanic population between 1990 and 2000 and beg the question: what will happen to the population distribution in years to come?
As the economy and immigration laws continue to change in the U.S. so too will the Hispanic population and its migration patterns. Studying spatial patterns like this leads to further understanding of economic, cultural, and demographic variation that the country is likely to experience in the future. While there are many factors that play a role in migration patterns and population increase throughout the U.S., Johnson and Lichter describe the effects possible implications of the trends:
“To be sure, Hispanics have revitalized many previously declining and economically stagnant small towns, but they have also brought serious and unprecedented challenges, including new demands for health care, bilingual education, as well as ethnic conflict and competition for scarce jobs (Johnson, Kenneth M. and Daniel T. Lichter. “Population Growth in New Hispanic Destinations.” Policy Brief No. 8 Carsey Institute Fall 2008 ).”
While this project only scratches the surface of the migration patterns and growing Hispanic population in the U.S., it is clear that further research could impact policy recommendations for important issues like health care, cultural integration, and employment rates across the country.