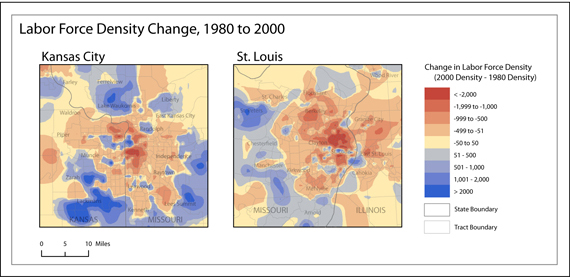
A labor force density change maps elucidates the spatiality of gains and losses. Positive values indicate a higher density in 2000 than in 1980. Likewise, negative values indicate a decline in labor force density.
In the KCMA, labor force declines are highest in the urban center, but we can also see gains in certain downtown neighborhoods. The highest gains in the KCMA are along the southern edge, particularly the Lackmans area, but there are also noticeable gains in other suburban areas. Although these suburban areas have experienced large gains, others have remained the same or have declined slightly.
The SLMA has also experienced high losses of labor force density in the urban core. Again, there are exceptions in small downtown pockets. The most notable gains are on the southern and western suburbs, particularly the St. Peters area. At the same time, labor force density in other suburban areas has stagnated or declined slightly.