Is there a Variation of the Effectiveness of these Models Across Space?
Did the Revised Model Change Anything?


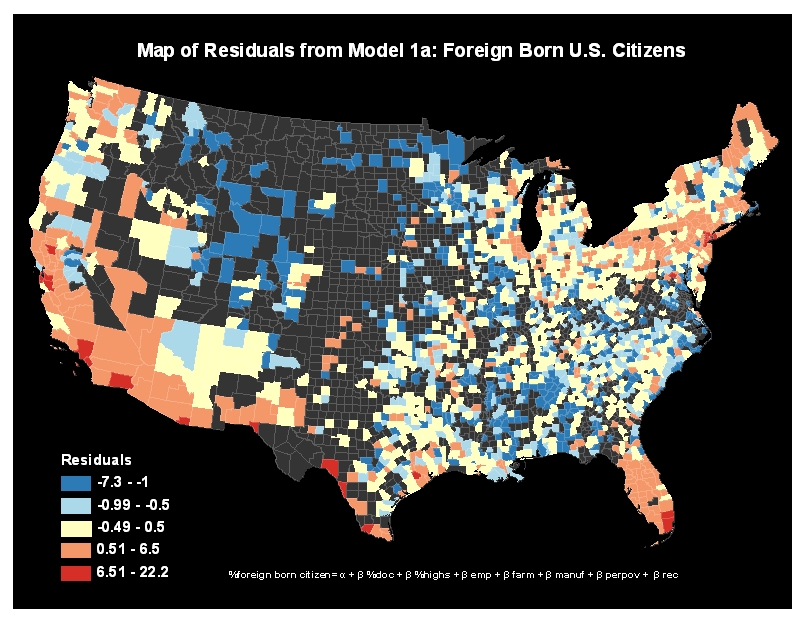
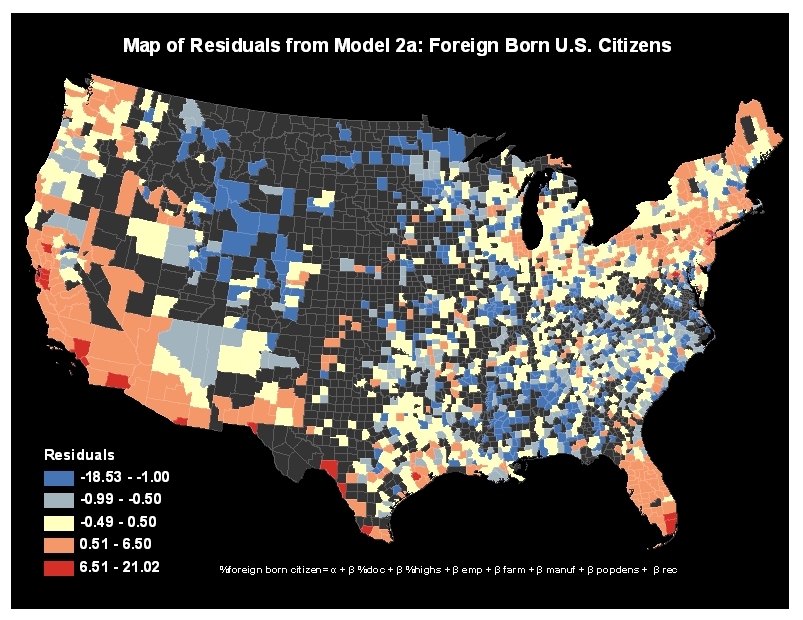
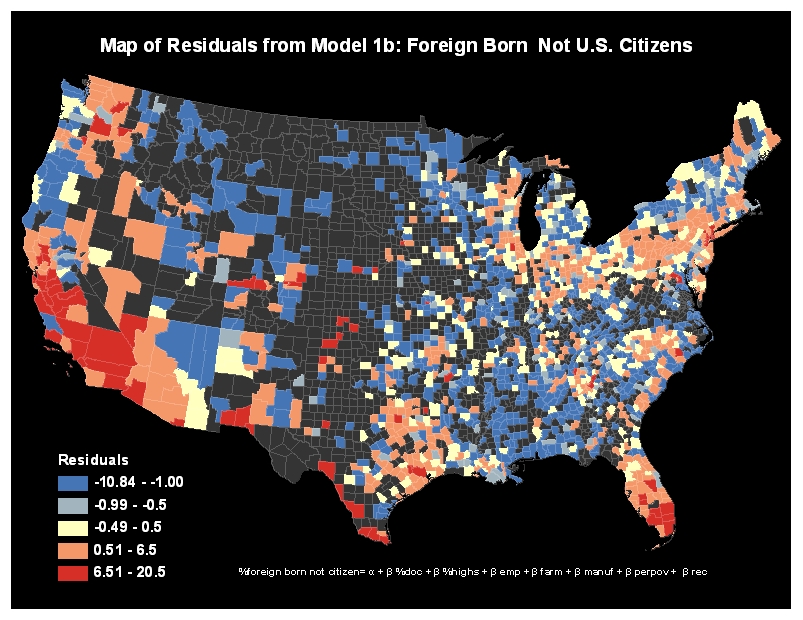
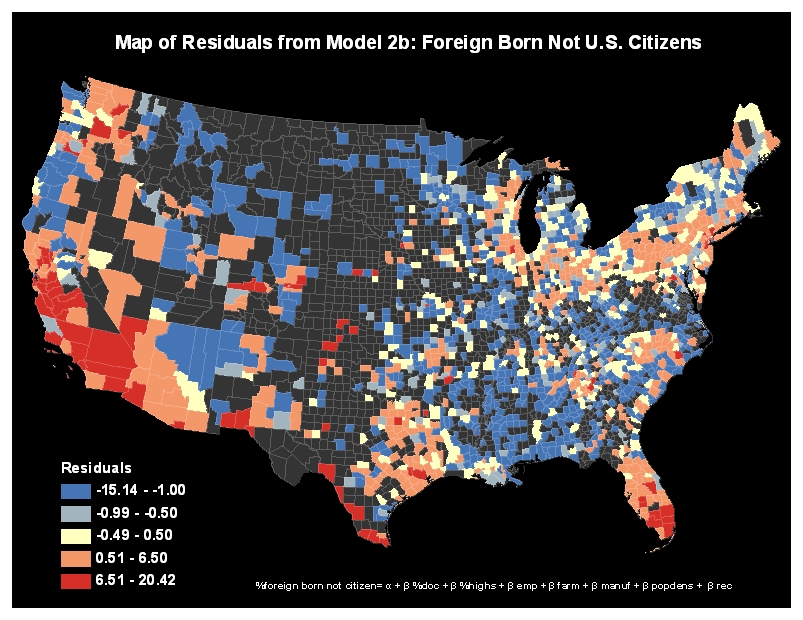
Spatially, the distribution of the residuals for both models is almost identical. Large underestimation in California, along the Mexican Border, and in high density areas. The revision of the model did not lead to a great improvement of the underestimation in the places that we had identified in the residuals map of Model 1. This could have many explanations. One possibility was the lack of transformation of the population density variable into the log of population density. Another explanation could be the fact that population density might have been already accounted for by other variables included in the model. The interesting pattern here is that whether using Model 1 or Model 2, places with high percentages of foreign born are constantly underestimated by a model that includes typical socioeconomic variables commonly used to explain what attracts immigrants into an area. This shows that immigration is a very complex phenomenon that is affected by very unique factors at every location.