Understanding the Shifts: Profile of the Electorate
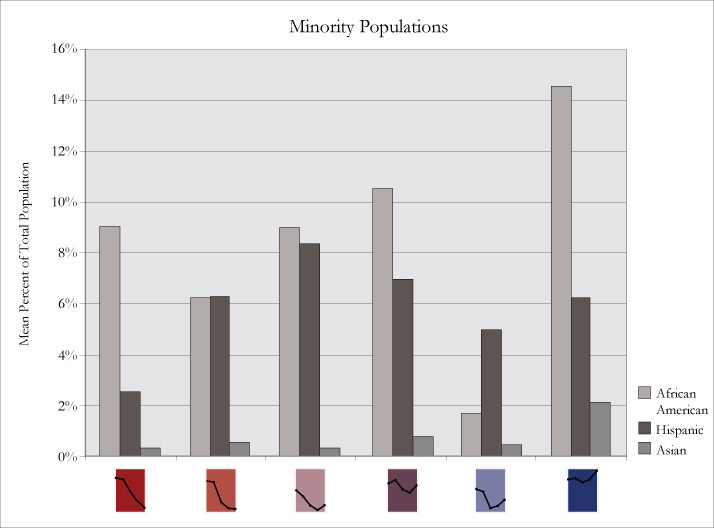
Counties with consistent Democratic increases (blue) have the largest African American populations, whereas counties with historically Republican increases (red, light red, light purple) have significantly smaller black populations. This is unsurprising, seeing as African Americans have been affiliated with the Democratic Party since the passage of the Civil Rights Act of 1964. Interestingly, the black population is prominent in the red, light purple, and blue purple clusters, indicating its far-reaching dispersion across rural and urban counties in all regions, most particularly the south.
The Hispanic vote, conversely, is spread across several shift-prone clusters (light purple, blue purple). Analysts suggest that the widespread Hispanic population itself may have helped produce the shifts. Their historic ties to the Democratic Party, weakening since 2000, have gained renewed strength with the 2008 election. This reversal is confirmed by statistics from the Pew Hispanic Center: some 57% of Hispanic registered voters currently identify with or lean toward the Democrats, with only 23% aligning with the Republicans (Taylor, Paul and Fry, Richard. “Hispanics and the 2008 Election: A Swing Vote?” Pew Hispanic Center. 6 Dec 2007. Available: http://pewhispanic.org/files/reports/83.pdf). This shift can be attributed in part to the Democratic Party’s more sympathetic platform on illegal immigration, a key issue among the Hispanic population.
The Asian population, remarkably diverse in composition and still relatively small in comparison to other minority groups, does not appear to have developed strong party allegiances. Indeed, a large portion of Asian-American voters remained uncommitted in the months leading up to the 2008 election(“Asian Americans Important Voter Group in Election Swing States.” America.gov: Engaging the World. 8 Oct 2008. Available: http://www.america.gov/st/elections08-english/2008/October/20081029172619bpuh0.6643749.html?CP.rss=true). It has shown Republican support in the past due to the economic conservatism among Asian populations. The increasingly well-educated minority group has also demonstrated Democratic support, as seen in the relatively large allocation of the Asian population in the blue cluster. However, this relationship may be mostly geographic: there are larges numbers of Asian minorities in the consistently Democratic Pacific region.
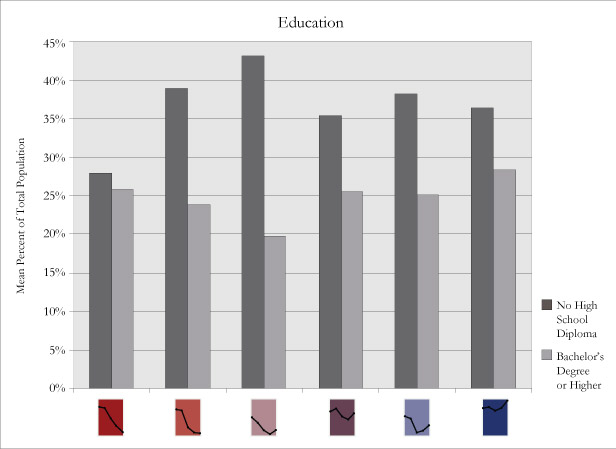
Educational attainment does not appear to have strong explanatory power for either the cluster solution, or party affiliation at large. The literature on electoral geography confirms, however, that higher levels of educational attainment generally lead to higher voter turnout and political participation.
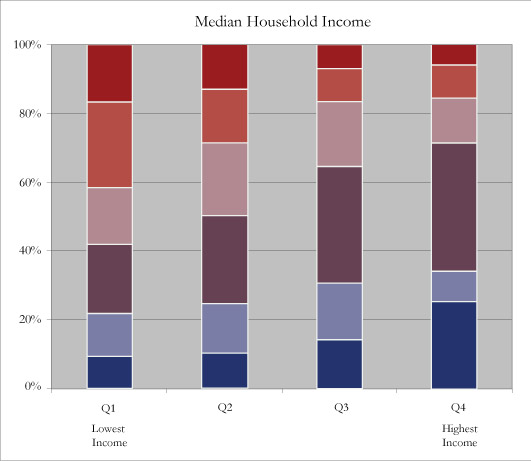
Blue and blue purple clusters are largest in the two highest income quartiles, while the red and light red clusters are most prominent in the two lowest income quartiles. Overall, the chart seems to point to a reversal of traditionally working-class Democrats into Republican supporters, and traditionally affluent Republicans into Democratic supporters. Observers explain this turnaround by voter values, offering the increasing importance of racial issues, such as busing and affirmative action, and cultural issues, such as abortion rights as instigating forces (Edsall, Thomas B. “Voter Values Determine Political Affiliation.” The Washington Post. 26 Mar 2001. Available: http://www.washingtonpost.com/ac2/wp-dyn/A56905-2001Mar25?language=printer). Furthermore, the light blue and light purple counties are more or less evenly distributed across the three lowest quartiles. Working class and middle class voters are a key swing constituency. While Democrats have retained steady support from labor union members, Republicans have made increasing gains among these classes (“GOP Makes Gains among the Working Class, White Democrats Hold On to the Union Vote.” The Pew Research Center. 2 Aug 2005. Available: http://people-press.org/commentary/?analysisid=114). Ultimately, however, it is difficult to find definitive patterns between income and voting trends. This could be attributed in part to generally low voter turnout among people in the lowest income brackets, the influence of church membership, and strong correlation with other demographic variables such as race and education.