The Blue Line:
Serving old neighborhoods
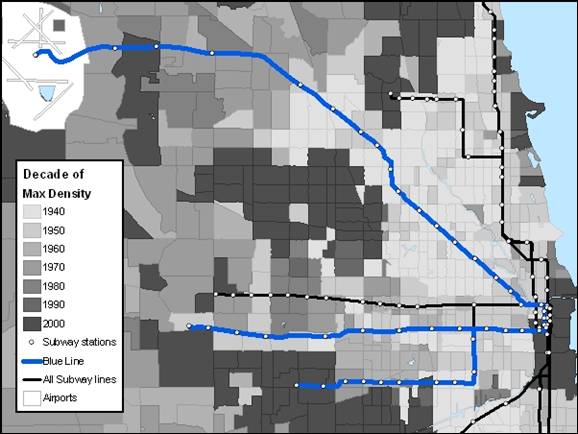
This is the same decade of maximum density map, but zoomed in on the Blue Line. The Blue Line is one that runs in the medians of expressways, so that explains why it is surrounded by areas of lower population density. But this map shows how the northerly Blue Line route passes through a whole swatch of tracts which reached their maximum density in 1940.
What this map also shows, however, is the patches of tracts which have only recently had their densities peak – and they might stop building. The way that these tracts are positioned is at the edge of the city and, of no small coincidence, in perfect formation to connect different lines if there were to be a “wheel” line to connect all of the spokes.
CLICK to check out a visualization of what this “wheel” line might look like and to read this geographer’s conclusions on the future of the Chicago “L.”