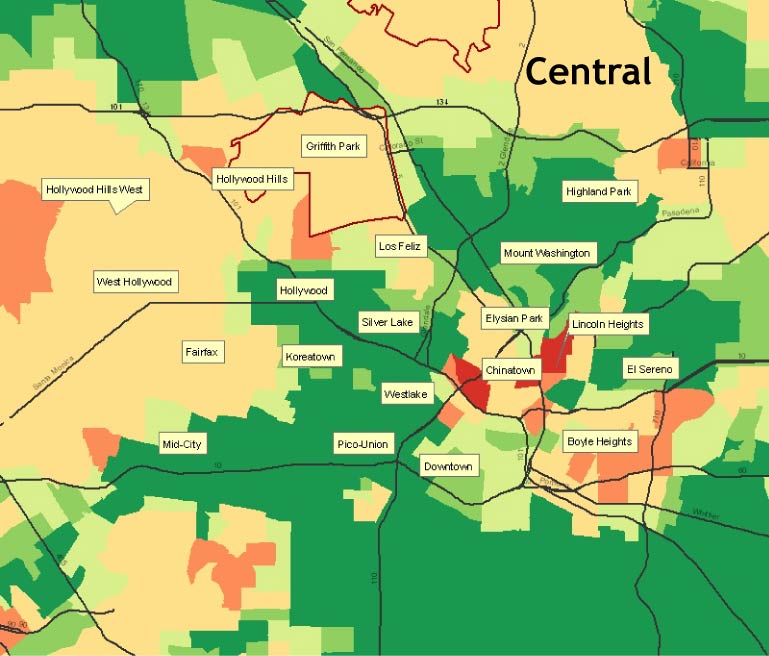
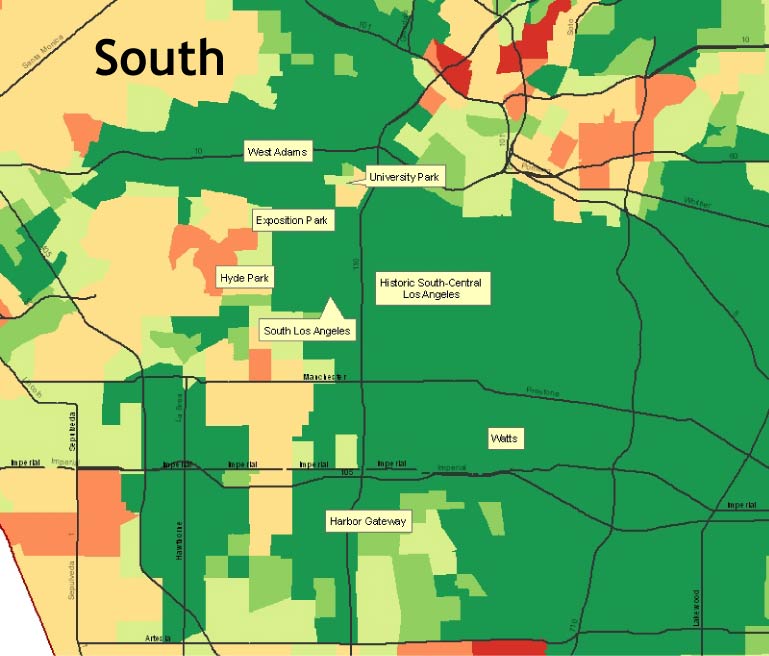
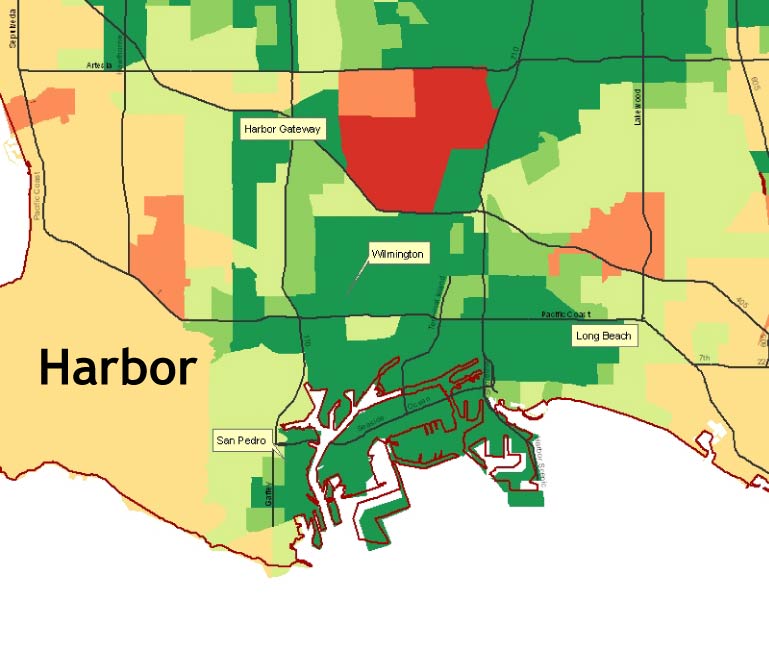
Here, I have included smaller, focused maps of different regions of the Los Angeles urban area to point out particular neighborhoods and communities that show varying levels of overall change in percent Hispanic populations between 1960 and 2000. In this map, note the different region names and locations as well as general trends in change over the entire study period.
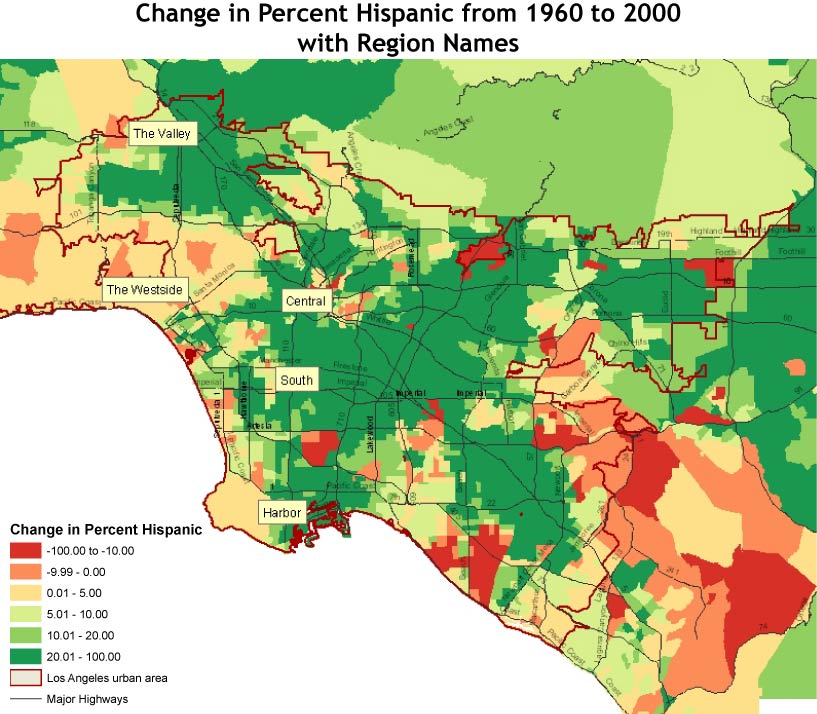
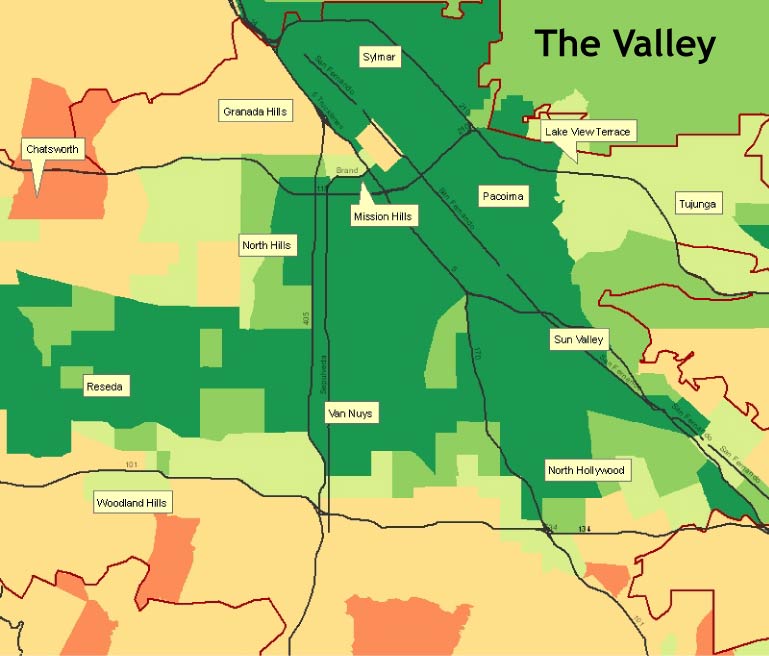
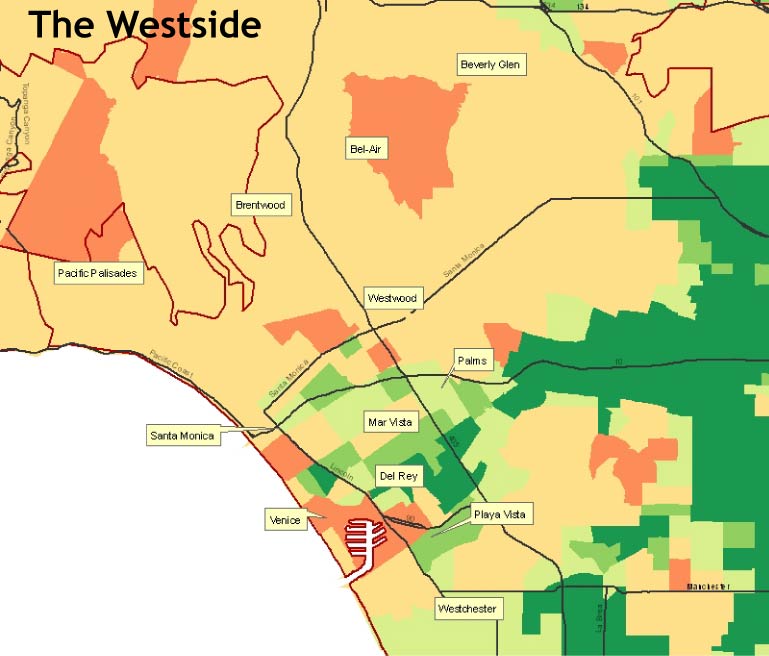
The following maps show the same population change trends at a smaller scale, by particular region. By focusing on these regions, individual neighborhoods are easier to discern and pick out according to the trends of change in percent Hispanic population.
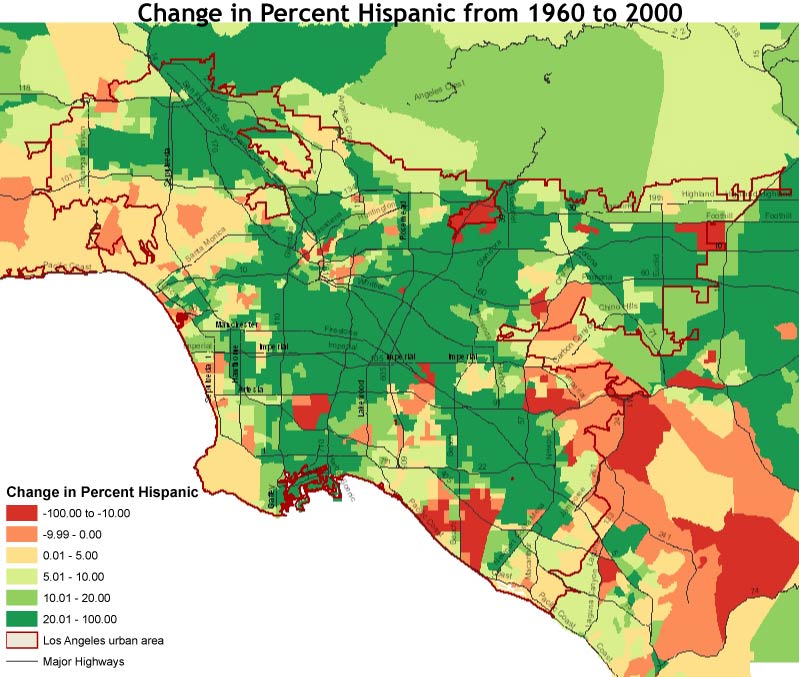
This last change map again displays change from 1960 to 2000 in percent Hispanic population, without region labels. Notice again the trends in different regions and neighborhoods in the above maps as they relate to the entire urban area.