Cluster analysis is a significant method of visualizing trends, by grouping together census tracts that have similar trends of growth or decline over the given time period. I used my data of percent Hispanic population over the five time periods to find seven separate clusters of trends. With these clusters, I created a chart to visualize each group’s pattern of growth and a map to see the different spatial patterns.
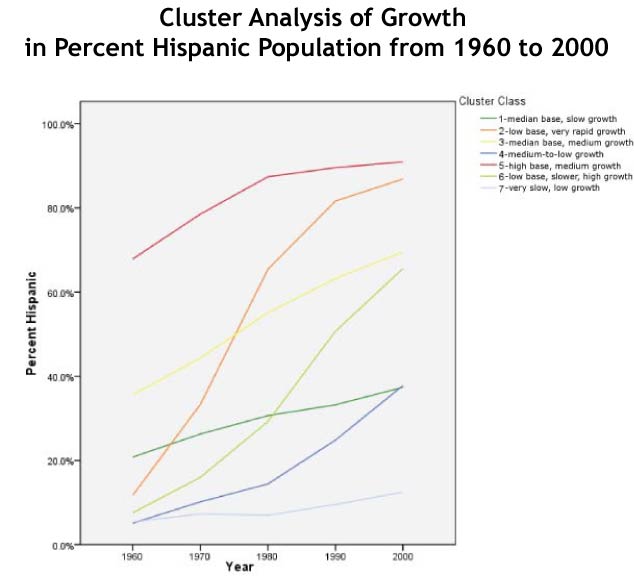
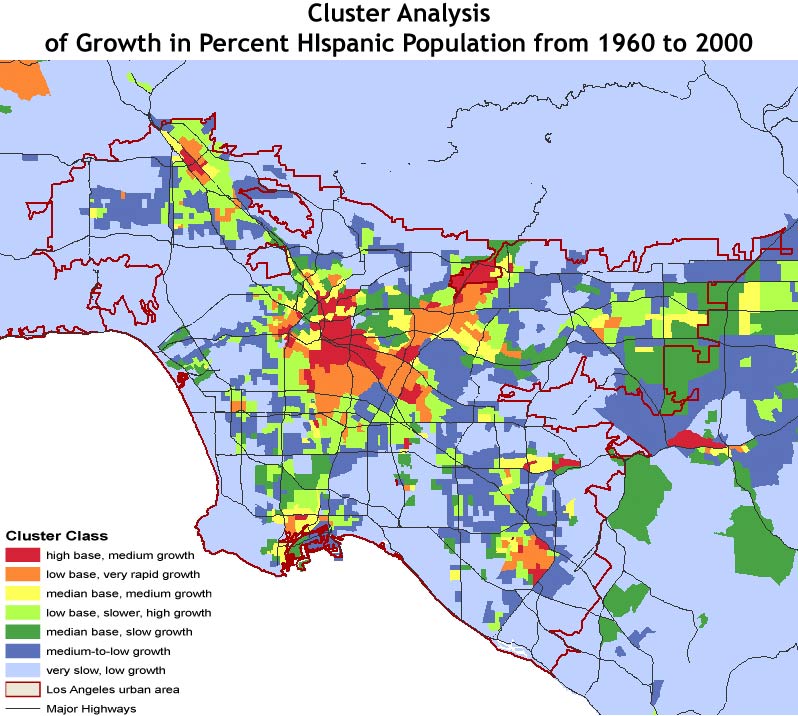
By observing this cluster map and the accompanying line graph, certain clusters and patterns are clear and worthy of note. Notice the red, orange, and yellow areas of the map highlighting areas of either stable Hispanic population or of very rapid growth as communities spread outwards. This map also acts to supplement the story of the previous change maps, by showing the high, stable populations in the central L.A. area that may not show significant growth in recent years but remain with extremely high Hispanic populations.