Bivariate mapping is a technique helpful in visualizing two different attributes in a map at the same time, in this case the percent Hispanic population and the percent of the total population 25 years old or older with less than a high school education. These three maps display these variables in the years 1960, 1980, and 2000, showing that as the percentage of the population with less than a high school education decreases, pockets of high Hispanic populations retain relatively high levels of low educational attainment.
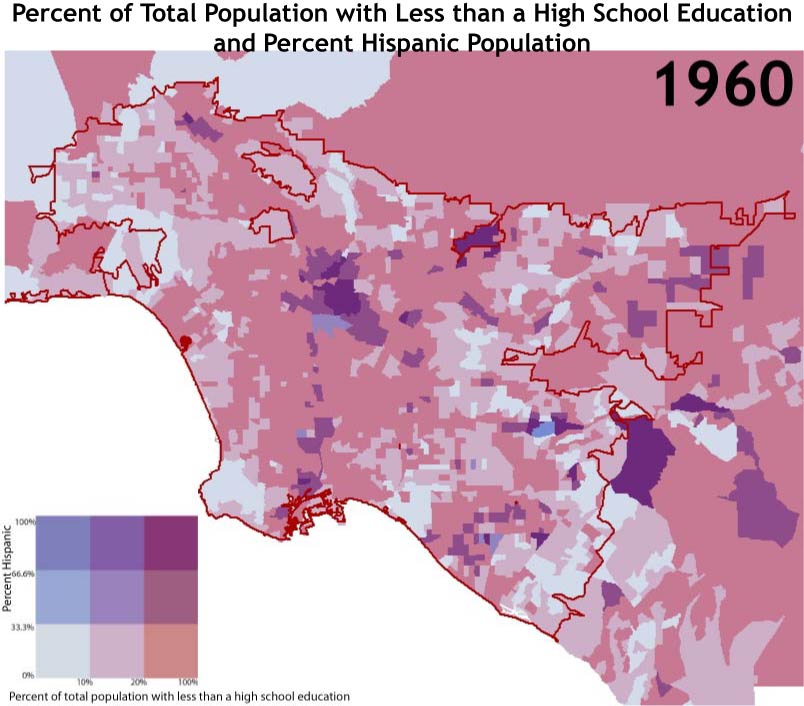
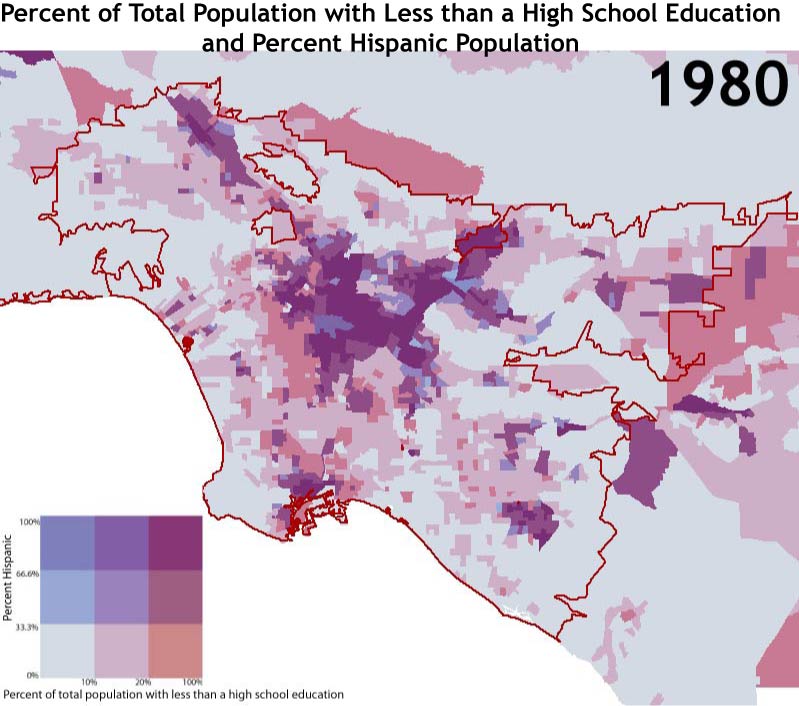
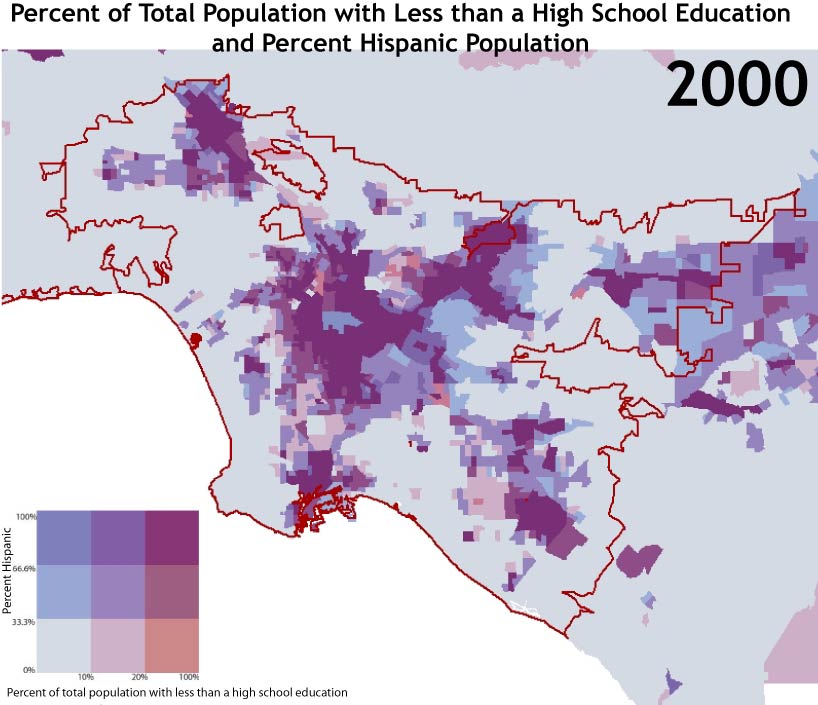
These clusters of high Hispanic population and low educational attainment highlight again some of the difficulties experienced by immigrant populations, some of which also have low proficiency in English. Note the contrast of light blue areas with low percentage of each factor, and the dark purple areas that show high concentration of both variables. These factors combined are certainly challenges to these communities of Hispanic populations.