Research into trends of gentrification has revealed a general pattern of a decline in minorities (usually represented by the Black population), and an increase in education and income among the new residents. Building on these findings, this analysis clusters tracts according to similarities in the change in the percent of the population that self-identified as Black, the change in the percent of the population as 25 and older that had completed at least 4 years of college, and the change in per capita income from 1980 to 2000 (for a more precise definition of variables, see Appendix).
Data for the variables in this analysis were standardized using Z-scores, which compare each value to the mean of all values for each year. The data for per capita income were standardized for each year before calculating the change, which was then standardized so that the mean centers of the variables for all clusters could be plotted on the same graph.
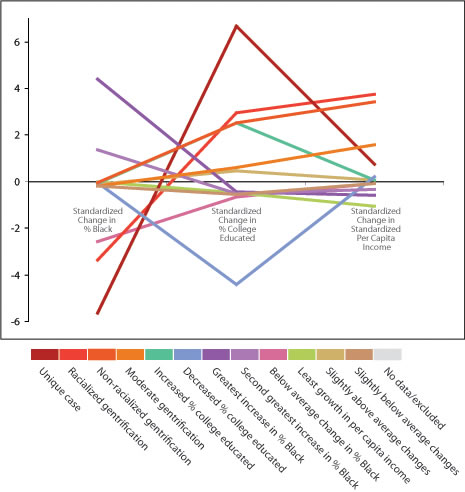
Each of the 12 clusters was named according to the type of gentrification that might be represented in those tracts, or in terms of another important pattern of neighborhood change. It is important to note that the trends in population data simply suggest the characteristic of the label. Each line on this graph represents a cluster of census tracts defined by similar trends in the input variables.
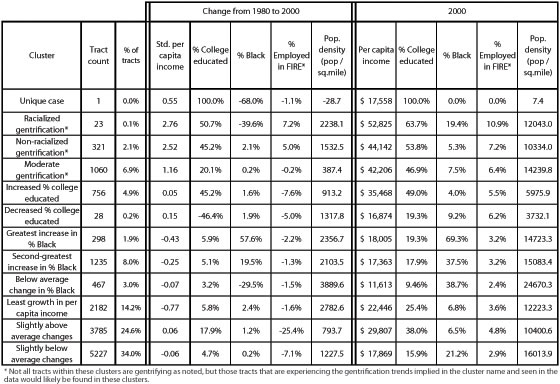
The “Unique Case” cluster consists of only one tract that seems to tell the standard story of gentrification—declining Black population and increasing educational attainment and income. Looking deeper, however, we see that the population density of this tract declined significantly from 1980 to 2000, with only about 7 people per square mile in 2000. This suggests that this tract may be in the initial stages of gentrification, or simply that it is an anomaly.
There were three clusters related to gentrification trends—“Racialized gentrification,” “Non-racialized gentrification,” and “Moderate gentrification.” These tracts in these three clusters experienced the greatest increase in Std. per capita income and % College educated. The “Racialized gentrification” cluster differs from the “Non-racialized gentrification” cluster in that these tracts experienced a large decline in % Black in addition to the increases in % College educated and Per capita income seen in the tracts in the other cluster. These findings challenge the traditional conceptualization of gentrification as displacing minority communities by isolating places that seem to be experiencing gentrification without the changes in the tracts’ racial profile. It is worth noting that even though the “Racialized gentrification” tracts declined in % Black, about 1 in 5 people identified as Black in the 2000 census. Tracts in other gentrification-related clusters reported only 5 to 8 % Black in 2000.
A high percentage of the work force employed in finance, insurance, and real estate (FIRE) has been used as an indicator of gentrification in the past, and is reflected in the results of this cluster analysis as well. The three gentrification-related clusters were the only ones to increase or stay the same in % Employed in FIRE from 1980 to 2000. About 20% of the workforce in the “Racialized gentrification” tracts were employed in this sector. Tracts in other clusters declined in % Employed in FIRE during this time period.
Other interesting population characteristics emerge in these clusters as well. For example, the “Greatest increase in % Black” and “Second-greatest increase in % Black” clusters highlight areas that increased significantly in % Black from 1980 to 2000. The “Below average change in % Black” cluster declined by about 30% in % Black during this time period, but still reported about 39 % Black in 2000. In addition, the stark contrast in the educational attainment trend between the “Increased % College Educated” and “Decreased % College Educated” clusters is interesting because they both were similarly about average for other variables. When examined in their spatial context, these clusters take on additional meaning in terms of city-scale population dynamics.
HOME ∙ NEXT