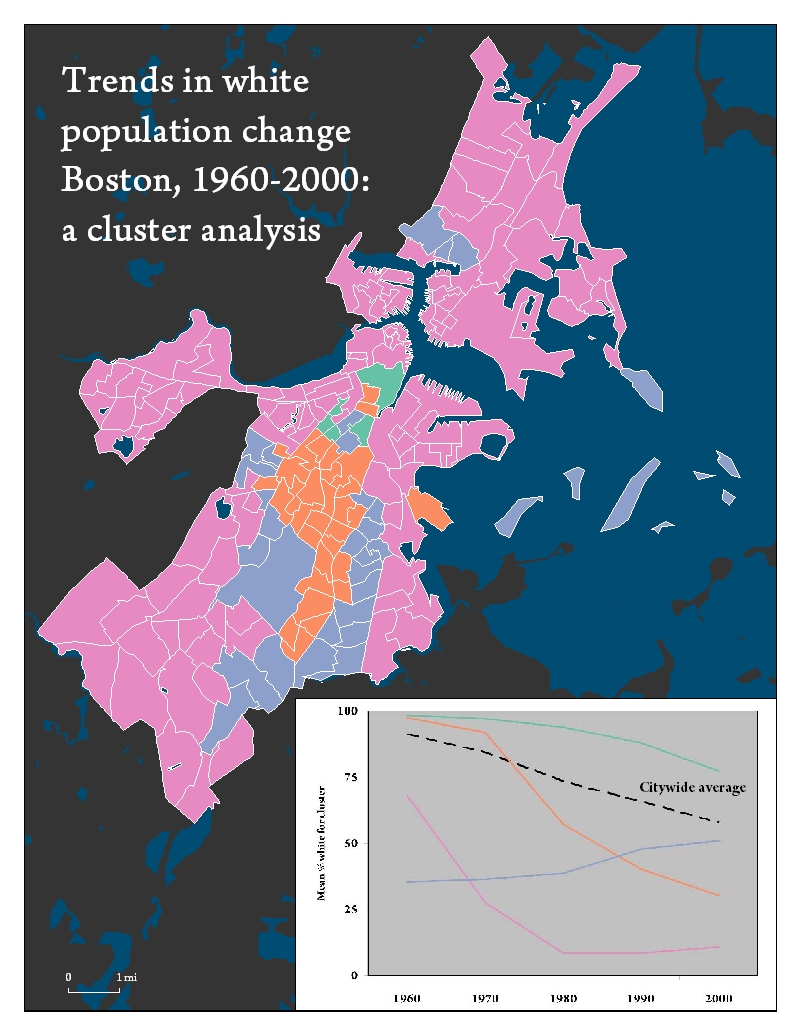
A cluster analysis was also applied to highlight trends in the change in percent White over time. Five clusters were produced. All but one experienced net decrease in percent White from 1960 to 2000. The tracts shown in purple steadily increased over time. These types of places are primarily located in south of the city. The orange tracts in the central core started out at extremely high percent White, then experienced sharp decrease after 1970, whereas the pink tracts encircling the city experienced drastic early decrease and stabilized at low percentages after 1980. Given the extremely low average for percent White in peripheral tracts (pink trend), this may suggest that the peripheral neighborhoods have become ethnic enclaves, whereas the more neutral average of 25% (orange trend) in the city center may indicate greater diversification rather than minorities replacing Whites entirely.