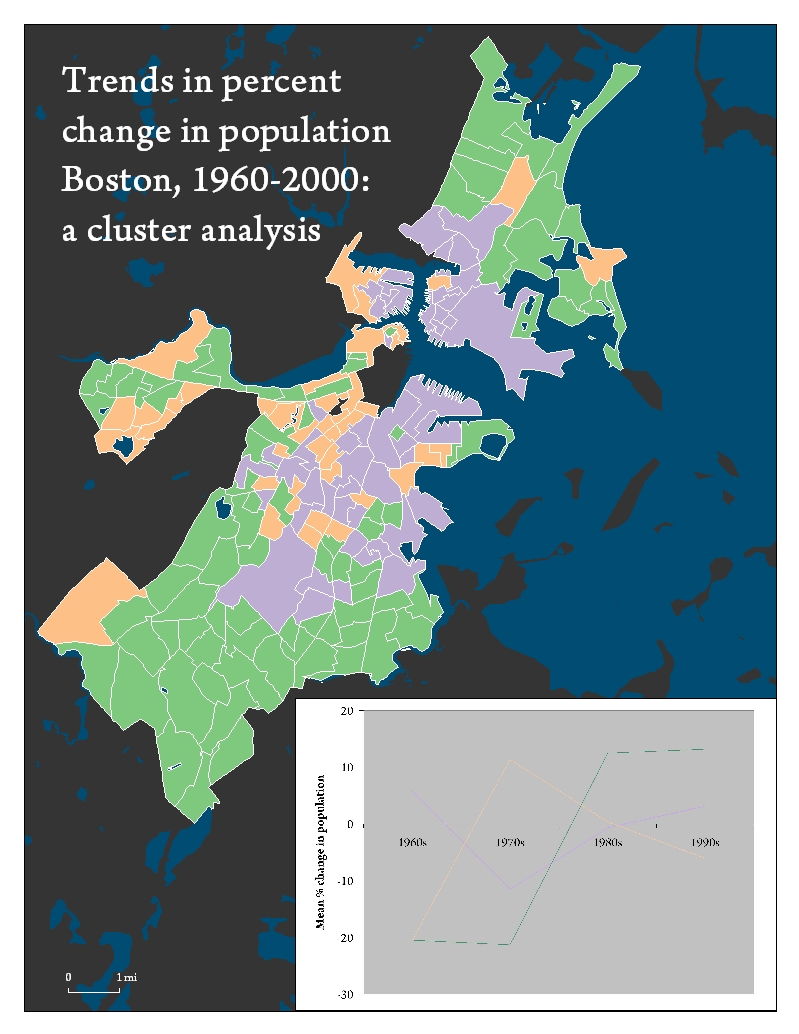
Since the total population in Boston experienced a net decrease from 1960 to 2000, but has been slowly increasing since 1980, I was interested in breaking down the trends in total population growth rates across the city. Five clusters offered the most insightful breakdown of trends, but two outlier clusters were eliminated from analysis (and mapping) because they contained just 2 or 3 tracts. The majority of tracts (i.e. those shown in green) decreased in population in the 1960s and 70s, but grew again in the 1980s and 1990s. These reflect the overall citywide trend (see Figure 1), which makes sense since they represent the majority. Many tracts in the center and northern parts of the city (purple) remained relatively stable throughout, with growth rates hovering around zero, except in the 1970s when they experienced moderate decrease. Tracts scattered throughout the center and western parts of the city (peach) had an opposite trend compared to purple tracts; they decreased in the 1960s, peaked in the 1970s with relatively high growth rates, and stabilized by the 1980s, with slight decrease in the 1990s.