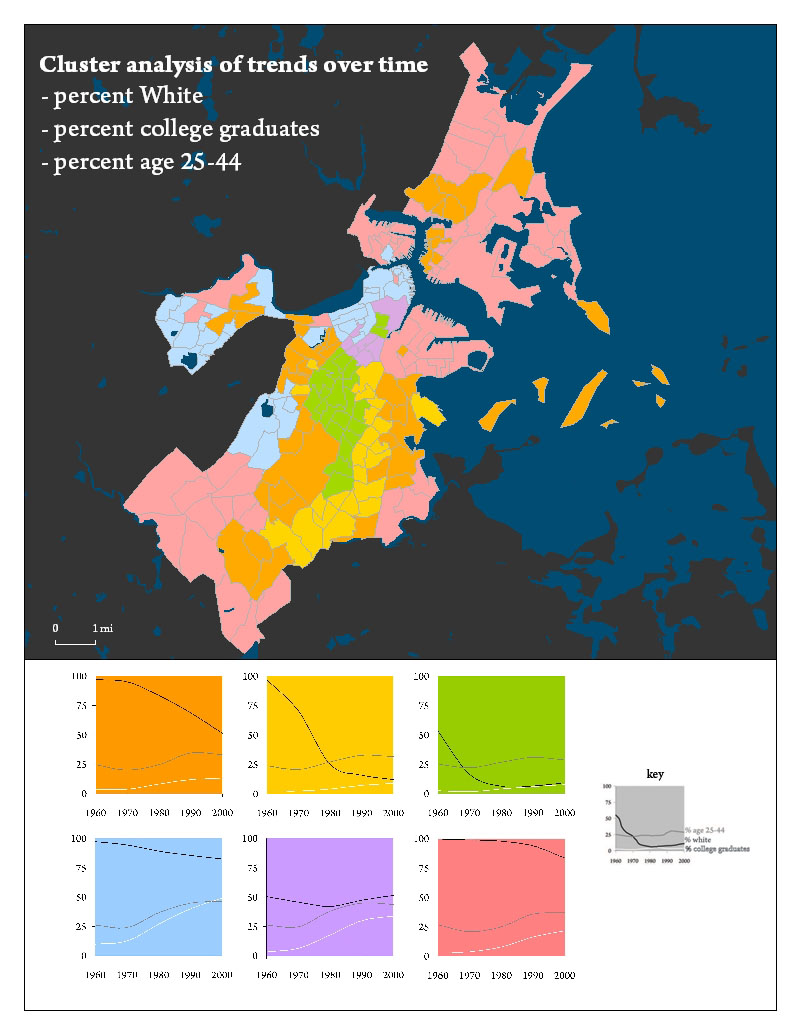
Finally I used cluster analysis to group tracts according to their like trends for all three variables: percent age 25-44, percent college graduates, and percent White. Six distinct groups were revealed. The biggest distinction between groups was in percent White, which is appropriate given that percent White of the citywide population changed the most from 1960 to 2000. The center of the city contained a pocket of uniform trends (green) with decreasing percent White and fairly stable college graduate population and aged 25-44. Tracts surrounding this center pocket (yellow) had a much more drastic decrease in percent White and slightly more pronounced increase in percent age 25-44. Orange tracts also bordered the core, with a sharp early decrease in percent White that never reaches the low percentages experienced in yellow and green tracts, but a more pronounced curve through the 70s and 80s in percent age 25-44. The center of the city is primarily made up of green, yellow, and orange tracts, which are overall similar in their trends of noticeably decreasing percent White, stable low percent college graduates, and subtly increasing percent age 25-44. This reveals a spatial pattern in trends, which confirms the explanatory value of these clusters.
Most residential neighborhoods in the city, as well as some areas on the downtown waterfront, are primarily pink; they remained very high in percent White throughout, with a subtle dip recently. Percent college graduates increased recently as well, and percent age 25-44 recovered after a decrease in the 70s. The blue tracts almost exclusively border the suburbs of Cambridge, and Brookline. These types of places were consistently high in percent White and experienced quite a noticeable increase in percent age 25-44 and college graduate. This indicates affluent places downtown, or at the edge of the city closely reflecting their suburban neighbors. It is interesting that the cluster with the most consistently high percent White was also the one with the biggest leap and highest end result for percent college-educated and percent age 25-44.
The purple pocket downtown remained fairly stable at around 50% White throughout but had a fairly noticeable increase in percent 25-44 and college graduates. This may indicate that it is a diverse neighborhood that has experienced a growth in housing opportunities that attracted more young educated people.